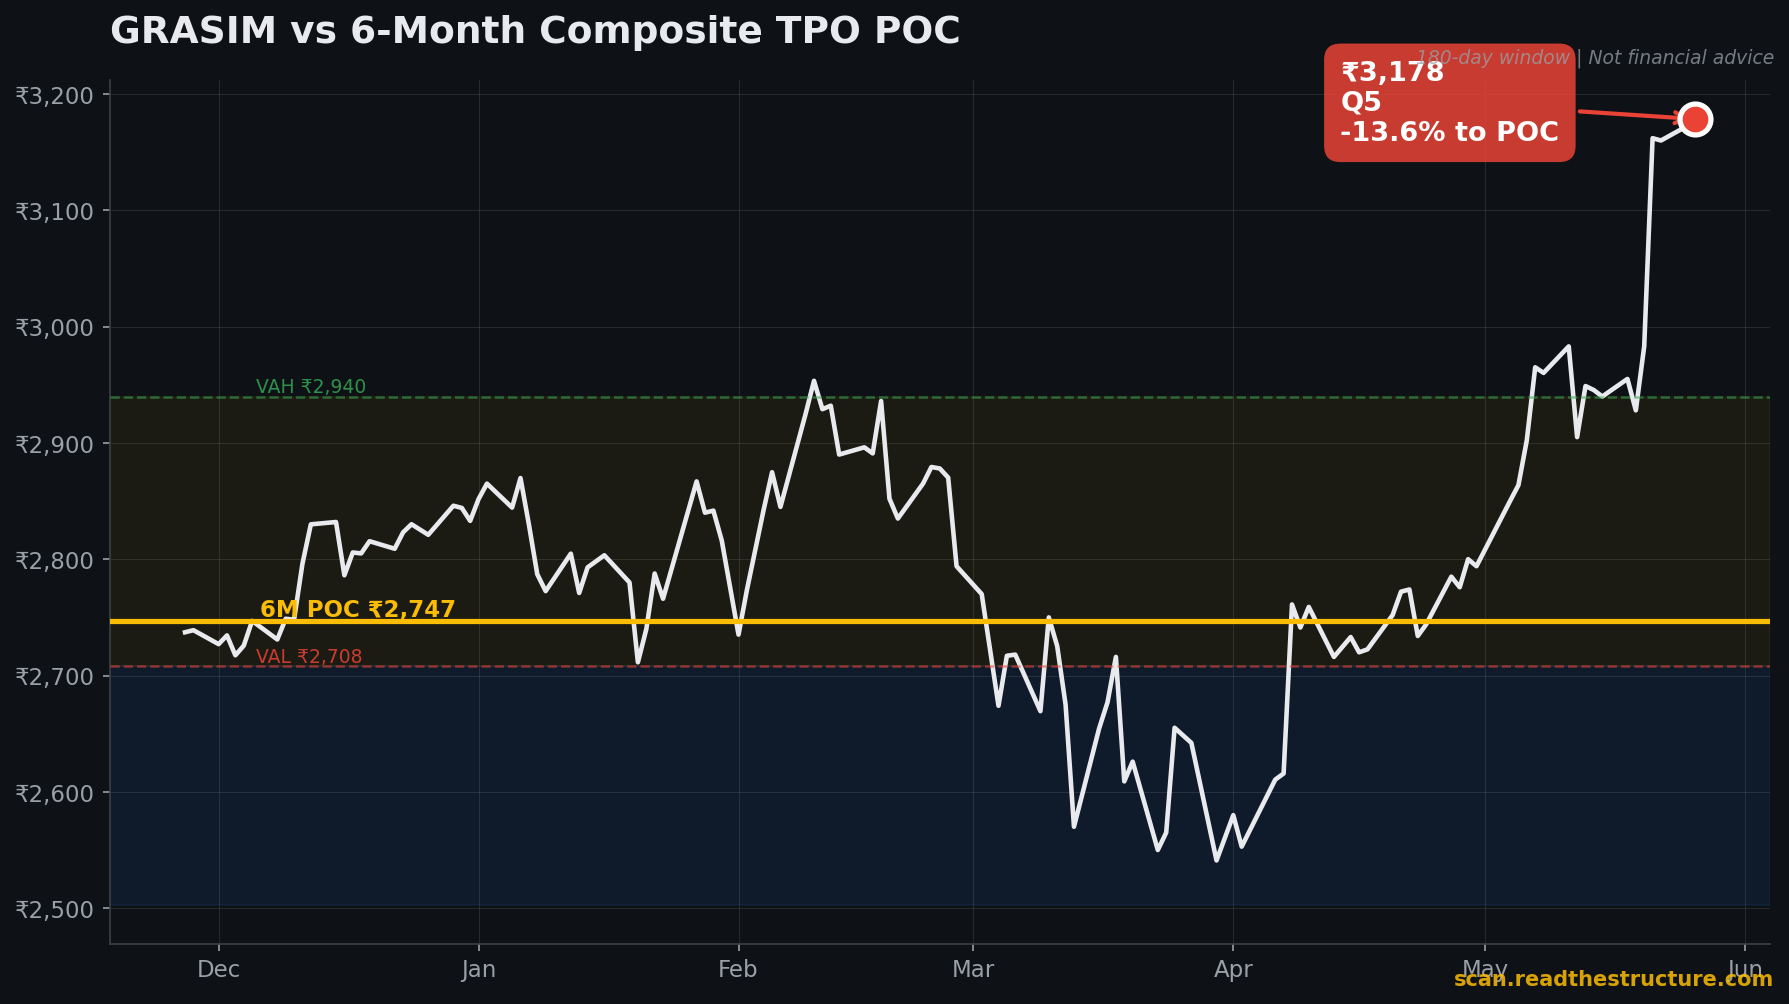
GRASIM is +13.9% from its 6M POC
Over-extended · spot ₹3,192 vs 6-month POC ₹2,748. Data as of 09 Jul 2026 close (IST).
Signal history
Distance from the 6-month POC over the last 90 trading days. The dashed line is the POC (fair value); below it = oversold.
The 6-month POC is the price where GRASIM traded most over the last 6 months — a fair-value anchor price tends to revert toward. A large negative "% from POC" means GRASIM is stretched below value; the tier (Q1 / Q1·DEEP) ranks how unusual that is versus its own 5-year history. Full methodology →
See the structure, not just the price.
This free daily snapshot is a glimpse of what ReadTheStructure is building — a full Market Profile toolkit for NSE & MCX traders: live TPO & Volume Profile, Initial Balance, value-area tracking, OrderFlow and market-pulse alerts. Launching soon.