TCS is -18.2% from its 6M POC
Oversold · spot ₹2,035 vs 6-month POC ₹2,405. Data as of 09 Jul 2026 close (IST).
Last updated 09 Jul 2026, 11:42 IST
Spot
₹2,035
6-month POC
₹2,405
% from POC
-18.2%
Upside to POC
+18.2%
Value-Area High
₹2,723
Value-Area Low
₹2,097
Signal tier
Q1
Option liquidity
HIGH
Hist Q1 hit (60d)
53%
Hist Q1 return (60d)
+1.5%
Today's readLOW
Structure: Deepest Q1 on the board (-18.2% from POC) but the weakest historical stats in the tier (~53% hit, ~+1.5% mean 60d).
News: Q1 FY27 results TONIGHT (Jul 9, post-close); Street expects flat revenue and wage-hike margin pressure; possible interim dividend (record ~Jul 15).
Key risk: Earnings tonight = IV crush + gap risk; a soft FY27 guide would extend the IT derate.
Signal history
Distance from the 6-month POC over the last 90 trading days. The dashed line is the POC (fair value); below it = oversold.
Now -18.2% · 90-day range -50.3% to -5.1% · since 2026-02-10
How to read this
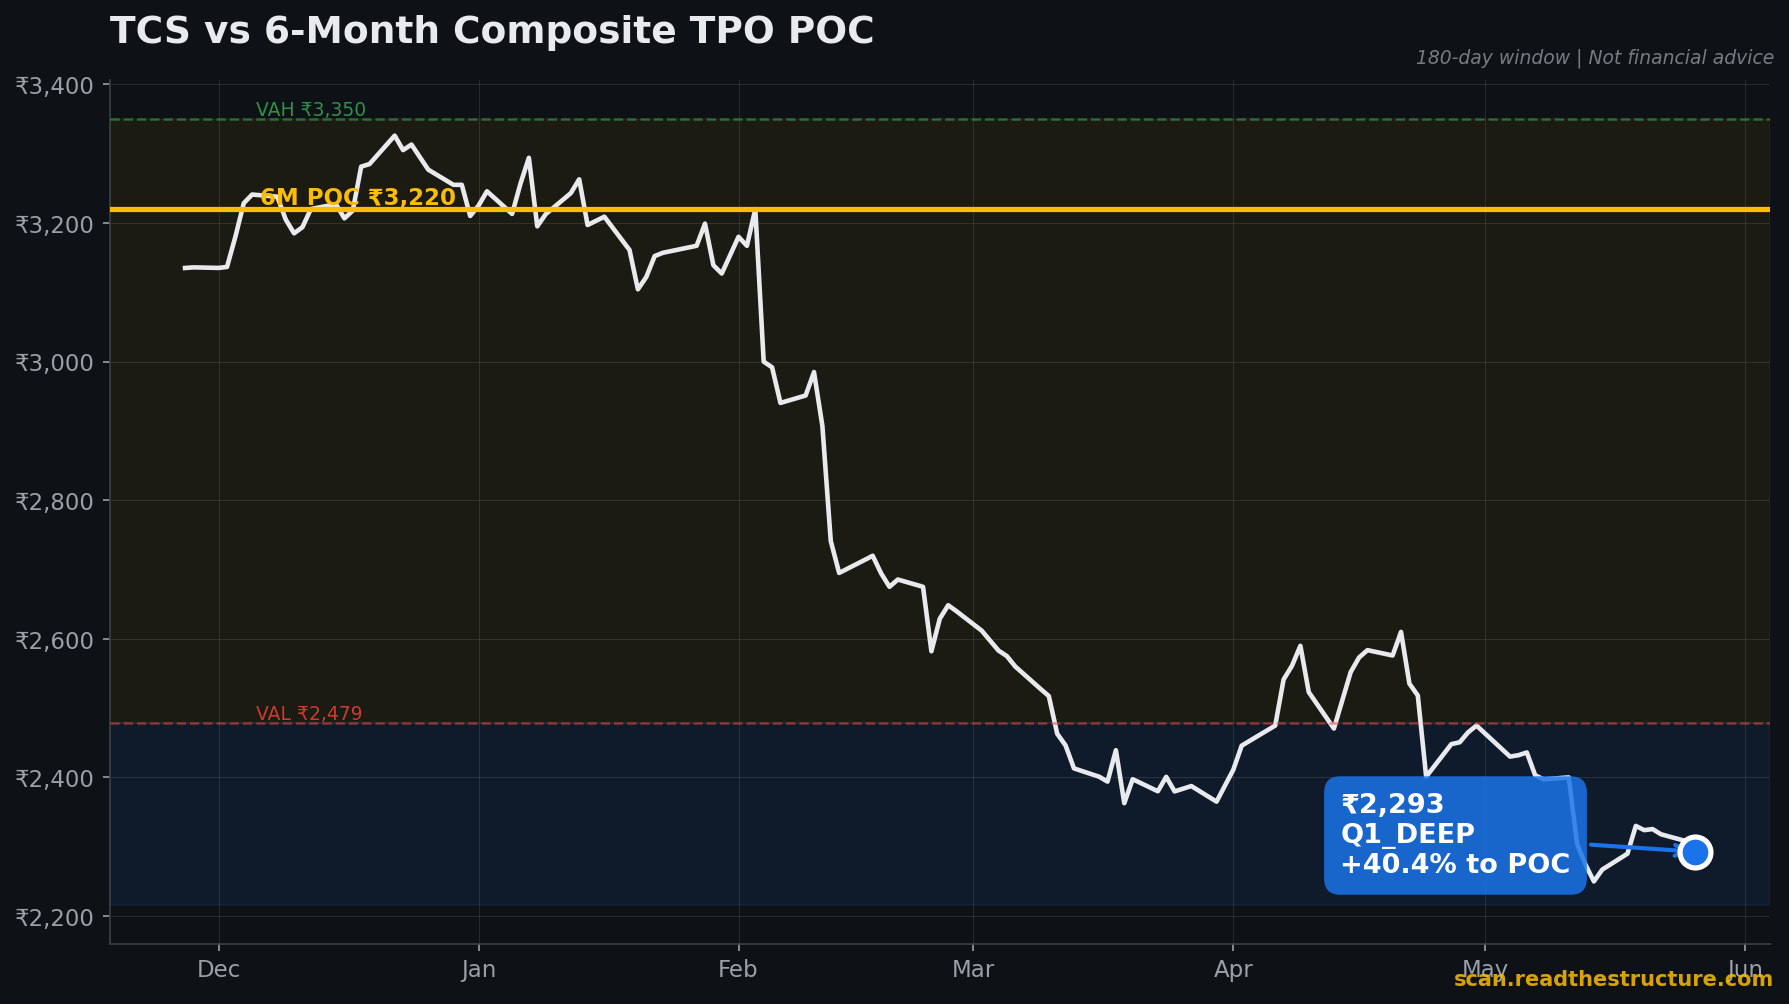
The 6-month POC is the price where TCS traded most over the last 6 months — a fair-value anchor price tends to revert toward. A large negative "% from POC" means TCS is stretched below value; the tier (Q1 / Q1·DEEP) ranks how unusual that is versus its own 5-year history. Full methodology →
See the structure, not just the price.
This free daily snapshot is a glimpse of what ReadTheStructure is building — a full Market Profile toolkit for NSE & MCX traders: live TPO & Volume Profile, Initial Balance, value-area tracking, OrderFlow and market-pulse alerts. Launching soon.
🚧 Platform launching soonLearn the method