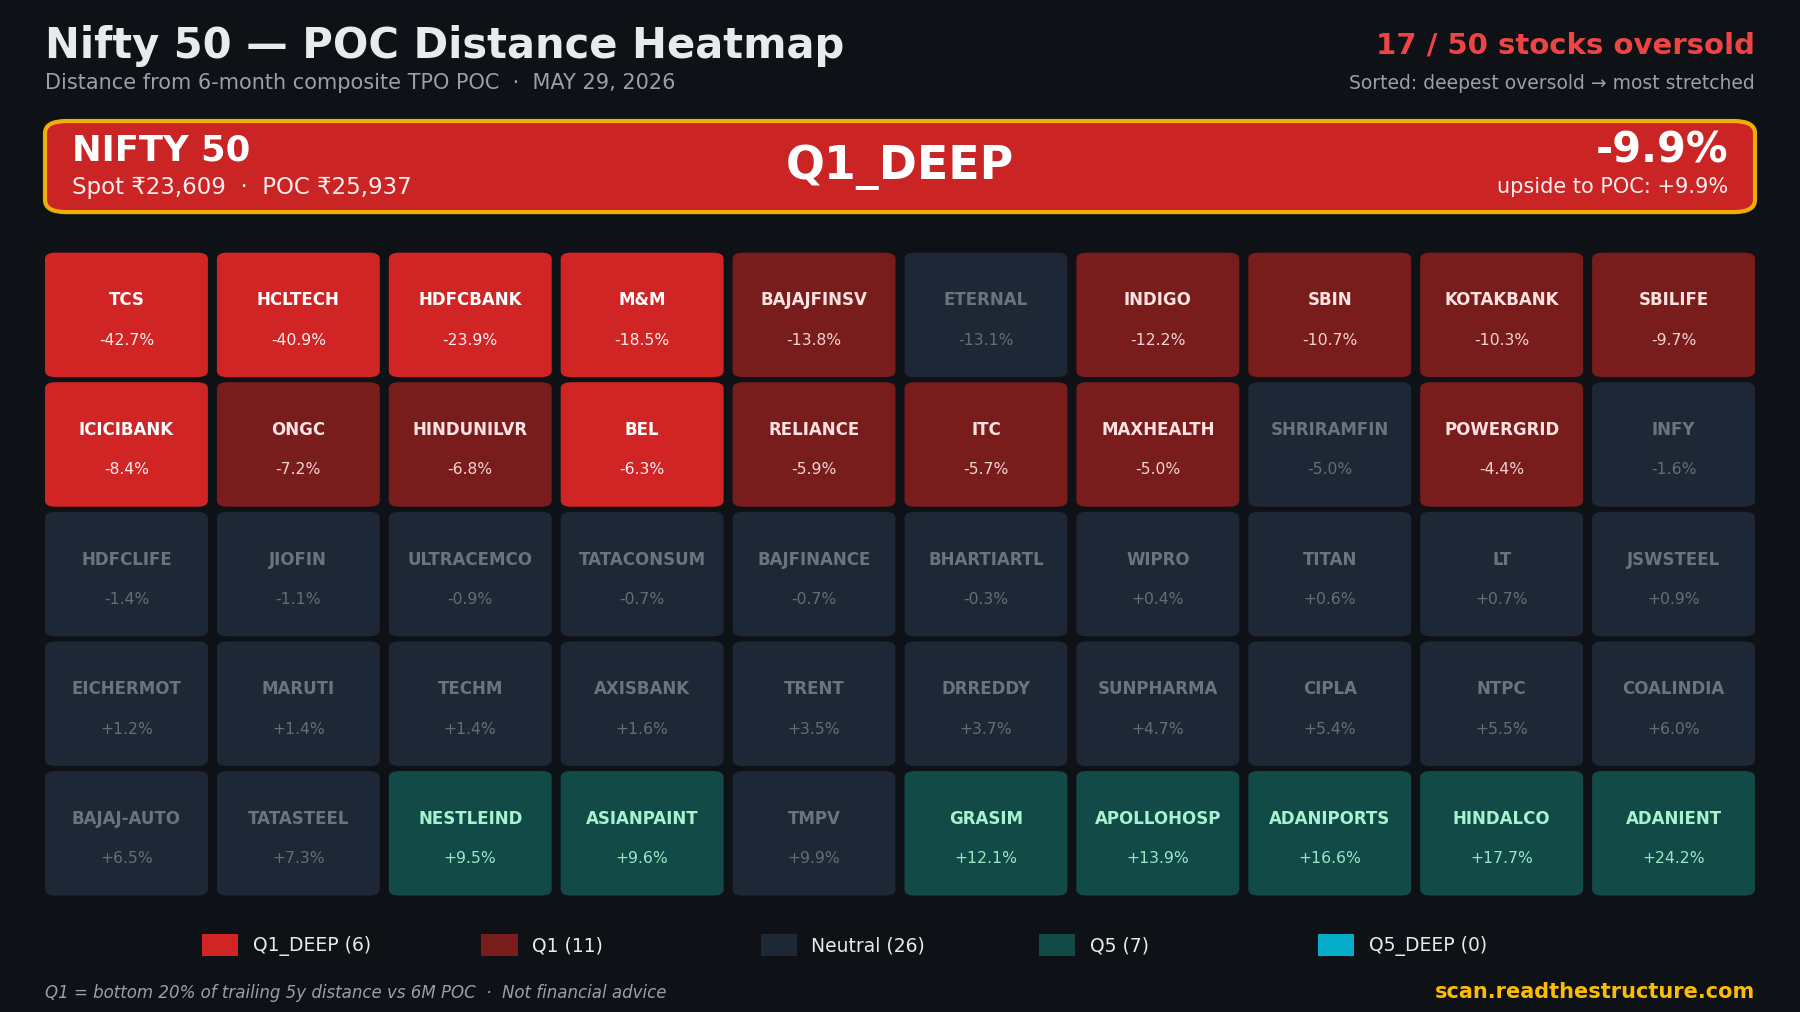
The index is -9.9% from its 6-month POC.
17 of 50 Nifty constituents are trading below value today — 6 of them deeply oversold. Here's the full structural picture: spot vs POC, value areas, and the mean-reversion tiers.
View full Nifty 50 detail — POC chart, value area & signal history →
Nifty closed at 23,609 — 9.9% below its 6-month POC of 25,937, putting the index in the deep-oversold (Q1_DEEP) tail. Breadth is broad-based weakness: 18 of 50 names sit in the oversold zone, 7 of them deeply. Historically this depth is a 60-day mean-reversion setup, but the bank-heavy tail is gated by the RBI MPC outcome on Jun 5 (consensus: hold at 5.25%). Depth alone is not edge — several of the deepest names show no historical mean-reversion advantage, so quality varies sharply across the oversold list.
Oversold watch — Q1 & Q1·DEEP
Constituents in the oversold quantile tiers, deepest first. These are the names the mean-reversion method watches. "Setup" is position-blind backtest-tier quality, not a recommendation. Stats are historical, not predictions.
| # | Stock | Signal | Setup | Spot | 6M POC | % from POC | Upside to POC | Value area (VAL–VAH) | Hist 60d hit | Hist 60d ret | Opt liq |
|---|---|---|---|---|---|---|---|---|---|---|---|
| 1 | TCS | Q1 · DEEP | MODERATE | ₹2,256 | ₹3,220 | -42.7% | +42.7% | 2,469.4 – 3,350.0 | 54% | +1.7% | HIGH |
| 2 | HCLTECH | Q1 · DEEP | STRONG | ₹1,182 | ₹1,665 | -40.9% | +40.9% | 1,361.9 – 1,780.1 | 67% | +7.9% | MED |
| 3 | HDFCBANK | Q1 · DEEP | MODERATE | ₹747.2 | ₹925.6 | -23.9% | +23.9% | 765.0 – 966.3 | 66% | +4.7% | HIGH |
| 4 | M&M | Q1 · DEEP | STRONG | ₹3,065 | ₹3,630 | -18.5% | +18.5% | 3,158.4 – 3,807.8 | 61% | +8.8% | LOW |
| 5 | ICICIBANK | Q1 · DEEP | STRONG | ₹1,259 | ₹1,365 | -8.4% | +8.4% | 1,277.8 – 1,429.5 | 70% | +6.7% | HIGH |
| 6 | BEL | Q1 · DEEP | — | ₹412.5 | ₹438.7 | -6.3% | +6.3% | 412.6 – 454.7 | 51% | +2.1% | LOW |
| 7 | BAJAJFINSV | Q1 | MODERATE | ₹1,798 | ₹2,046 | -13.8% | +13.8% | 1,783.7 – 2,103.8 | 72% | +13.6% | MED |
| 8 | INDIGO | Q1 | — | ₹4,425 | ₹4,966 | -12.2% | +12.2% | 4,271.2 – 5,063.5 | 50% | +3.2% | LOW |
| 9 | SBIN | Q1 | MODERATE | ₹965.0 | ₹1,068 | -10.7% | +10.7% | 969.4 – 1,115.0 | 83% | +9.1% | HIGH |
| 10 | KOTAKBANK | Q1 | — | ₹385.6 | ₹425.2 | -10.3% | +10.3% | 379.9 – 445.6 | 76% | +7.0% | HIGH |
| 11 | SBILIFE | Q1 | — | ₹1,839 | ₹2,016 | -9.7% | +9.7% | 1,887.2 – 2,105.3 | 74% | +7.4% | MED |
| 12 | ONGC | Q1 | — | ₹265.9 | ₹285.1 | -7.2% | +7.2% | 258.9 – 301.3 | 59% | +3.6% | MED |
| 13 | HINDUNILVR | Q1 | — | ₹2,162 | ₹2,308 | -6.8% | +6.8% | 2,211.5 – 2,433.1 | 68% | +4.3% | HIGH |
| 14 | RELIANCE | Q1 | MODERATE | ₹1,322 | ₹1,399 | -5.9% | +5.9% | 1,329.9 – 1,457.3 | 75% | +10.3% | HIGH |
| 15 | ITC | Q1 | BROKEN | ₹287.8 | ₹304.1 | -5.7% | +5.7% | 294.0 – 332.2 | 62% | +3.0% | HIGH |
| 16 | MAXHEALTH | Q1 | — | ₹965.0 | ₹1,014 | -5.0% | +5.0% | 949.0 – 1,062.2 | 70% | +8.2% | LOW |
| 17 | POWERGRID | Q1 | — | ₹287.7 | ₹300.2 | -4.4% | +4.4% | 281.3 – 323.0 | 58% | +2.8% | MED |
Today's read on the deepest setups
Position-blind notes on the most-stretched names — what the structure shows, recent news, and the key risk. Setup quality only; not a recommendation and not portfolio advice.
Events on the radar
Dividends, earnings and macro dates that can move these names or their option pricing over the next ~90 days.
| Stock | Event | Date | Type | Magnitude | Impact |
|---|---|---|---|---|---|
| MARKET | RBI MPC rate decision | Jun 5 | Macro | MEDIUM | Consensus is a hold at 5.25%; a hawkish surprise would pressure the index and rate-sensitive banks. |
| RELIANCE | 49th AGM + dividend record (Rs 6) | Jun 19 / Jun 5 | AGM/Dividend | MEDIUM | AGM is a binary catalyst; the small dividend is negligible for option pricing. |
| HDFCBANK | Dividend Rs 13 ex-date | ~Jun 19 | Dividend | SMALL | ~1.7% of price; modest adjustment to factor into any near-term position. |
| BEL | QRSAM contract signing | ~Jul 2026 | Order | LARGE | A large order catalyst, but lands after the near-term option window. |
Full Nifty 50 scan
Every constituent, sorted most-oversold to most-extended. Spot, 6-month POC and value-area bounds for all 50 names.
Show all 50 names
| Stock | Signal | Spot | 6M POC | % from POC | VAL | VAH |
|---|---|---|---|---|---|---|
| TCS | Q1 · DEEP | ₹2,256 | ₹3,220 | -42.7% | ₹2,469 | ₹3,350 |
| HCLTECH | Q1 · DEEP | ₹1,182 | ₹1,665 | -40.9% | ₹1,362 | ₹1,780 |
| HDFCBANK | Q1 · DEEP | ₹747.2 | ₹925.6 | -23.9% | ₹765.0 | ₹966.3 |
| M&M | Q1 · DEEP | ₹3,065 | ₹3,630 | -18.5% | ₹3,158 | ₹3,808 |
| BAJAJFINSV | Q1 | ₹1,798 | ₹2,046 | -13.8% | ₹1,784 | ₹2,104 |
| ETERNAL | MID | ₹251.9 | ₹284.9 | -13.1% | ₹246.6 | ₹305.7 |
| INDIGO | Q1 | ₹4,425 | ₹4,966 | -12.2% | ₹4,271 | ₹5,064 |
| SBIN | Q1 | ₹965.0 | ₹1,068 | -10.7% | ₹969.4 | ₹1,115 |
| KOTAKBANK | Q1 | ₹385.6 | ₹425.2 | -10.3% | ₹379.9 | ₹445.6 |
| SBILIFE | Q1 | ₹1,839 | ₹2,016 | -9.7% | ₹1,887 | ₹2,105 |
| ICICIBANK | Q1 · DEEP | ₹1,259 | ₹1,365 | -8.4% | ₹1,278 | ₹1,430 |
| ONGC | Q1 | ₹265.9 | ₹285.1 | -7.2% | ₹258.9 | ₹301.3 |
| HINDUNILVR | Q1 | ₹2,162 | ₹2,308 | -6.8% | ₹2,211 | ₹2,433 |
| BEL | Q1 · DEEP | ₹412.5 | ₹438.7 | -6.3% | ₹412.6 | ₹454.7 |
| RELIANCE | Q1 | ₹1,322 | ₹1,399 | -5.9% | ₹1,330 | ₹1,457 |
| ITC | Q1 | ₹287.8 | ₹304.1 | -5.7% | ₹294.0 | ₹332.2 |
| MAXHEALTH | Q1 | ₹965.0 | ₹1,014 | -5.0% | ₹949.0 | ₹1,062 |
| SHRIRAMFIN | MID | ₹952.7 | ₹1,000 | -5.0% | ₹936.2 | ₹1,071 |
| POWERGRID | Q1 | ₹287.7 | ₹300.2 | -4.4% | ₹281.3 | ₹323.0 |
| INFY | MID | ₹1,156 | ₹1,175 | -1.6% | ₹1,089 | ₹1,596 |
| HDFCLIFE | MID | ₹596.5 | ₹604.6 | -1.4% | ₹555.1 | ₹734.5 |
| JIOFIN | MID | ₹240.1 | ₹242.7 | -1.1% | ₹226.0 | ₹269.8 |
| ULTRACEMCO | MID | ₹11,501 | ₹11,601 | -0.9% | ₹11,322 | ₹12,715 |
| TATACONSUM | MID | ₹1,174 | ₹1,182 | -0.7% | ₹1,099 | ₹1,203 |
| BAJFINANCE | MID | ₹909.8 | ₹916.3 | -0.7% | ₹893.3 | ₹1,013 |
| BHARTIARTL | MID | ₹1,827 | ₹1,833 | -0.3% | ₹1,757 | ₹2,014 |
| WIPRO | MID | ₹204.3 | ₹203.4 | +0.4% | ₹186.5 | ₹241.7 |
| TITAN | MID | ₹4,111 | ₹4,086 | +0.6% | ₹3,891 | ₹4,301 |
| LT | MID | ₹4,090 | ₹4,060 | +0.7% | ₹3,816 | ₹4,189 |
| JSWSTEEL | MID | ₹1,284 | ₹1,272 | +0.9% | ₹1,160 | ₹1,296 |
| EICHERMOT | MID | ₹7,212 | ₹7,125 | +1.2% | ₹6,853 | ₹7,425 |
| MARUTI | MID | ₹13,200 | ₹13,018 | +1.4% | ₹12,253 | ₹15,271 |
| TECHM | MID | ₹1,480 | ₹1,459 | +1.4% | ₹1,318 | ₹1,587 |
| AXISBANK | MID | ₹1,291 | ₹1,271 | +1.6% | ₹1,222 | ₹1,351 |
| TRENT | MID | ₹4,240 | ₹4,090 | +3.5% | ₹3,811 | ₹4,329 |
| DRREDDY | MID | ₹1,320 | ₹1,271 | +3.7% | ₹1,240 | ₹1,336 |
| SUNPHARMA | MID | ₹1,804 | ₹1,720 | +4.7% | ₹1,686 | ₹1,842 |
| CIPLA | MID | ₹1,400 | ₹1,325 | +5.4% | ₹1,237 | ₹1,472 |
| NTPC | MID | ₹389.0 | ₹367.6 | +5.5% | ₹352.1 | ₹407.9 |
| COALINDIA | MID | ₹458.3 | ₹431.0 | +6.0% | ₹415.8 | ₹463.4 |
| BAJAJ-AUTO | MID | ₹10,472 | ₹9,786 | +6.5% | ₹8,938 | ₹9,928 |
| TATASTEEL | MID | ₹210.2 | ₹194.9 | +7.3% | ₹179.8 | ₹211.7 |
| NESTLEIND | Q5 | ₹1,443 | ₹1,306 | +9.5% | ₹1,186 | ₹1,325 |
| ASIANPAINT | Q5 | ₹2,688 | ₹2,430 | +9.6% | ₹2,347 | ₹2,831 |
| TMPV | MID | ₹395.0 | ₹355.9 | +9.9% | ₹335.0 | ₹377.3 |
| GRASIM | Q5 | ₹3,125 | ₹2,747 | +12.1% | ₹2,711 | ₹2,947 |
| APOLLOHOSP | Q5 | ₹8,224 | ₹7,081 | +13.9% | ₹7,004 | ₹7,772 |
| ADANIPORTS | Q5 | ₹1,809 | ₹1,509 | +16.6% | ₹1,339 | ₹1,580 |
| HINDALCO | Q5 | ₹1,133 | ₹933.0 | +17.7% | ₹810.0 | ₹990.0 |
| ADANIENT | Q5 | ₹2,940 | ₹2,230 | +24.2% | ₹1,888 | ₹2,337 |
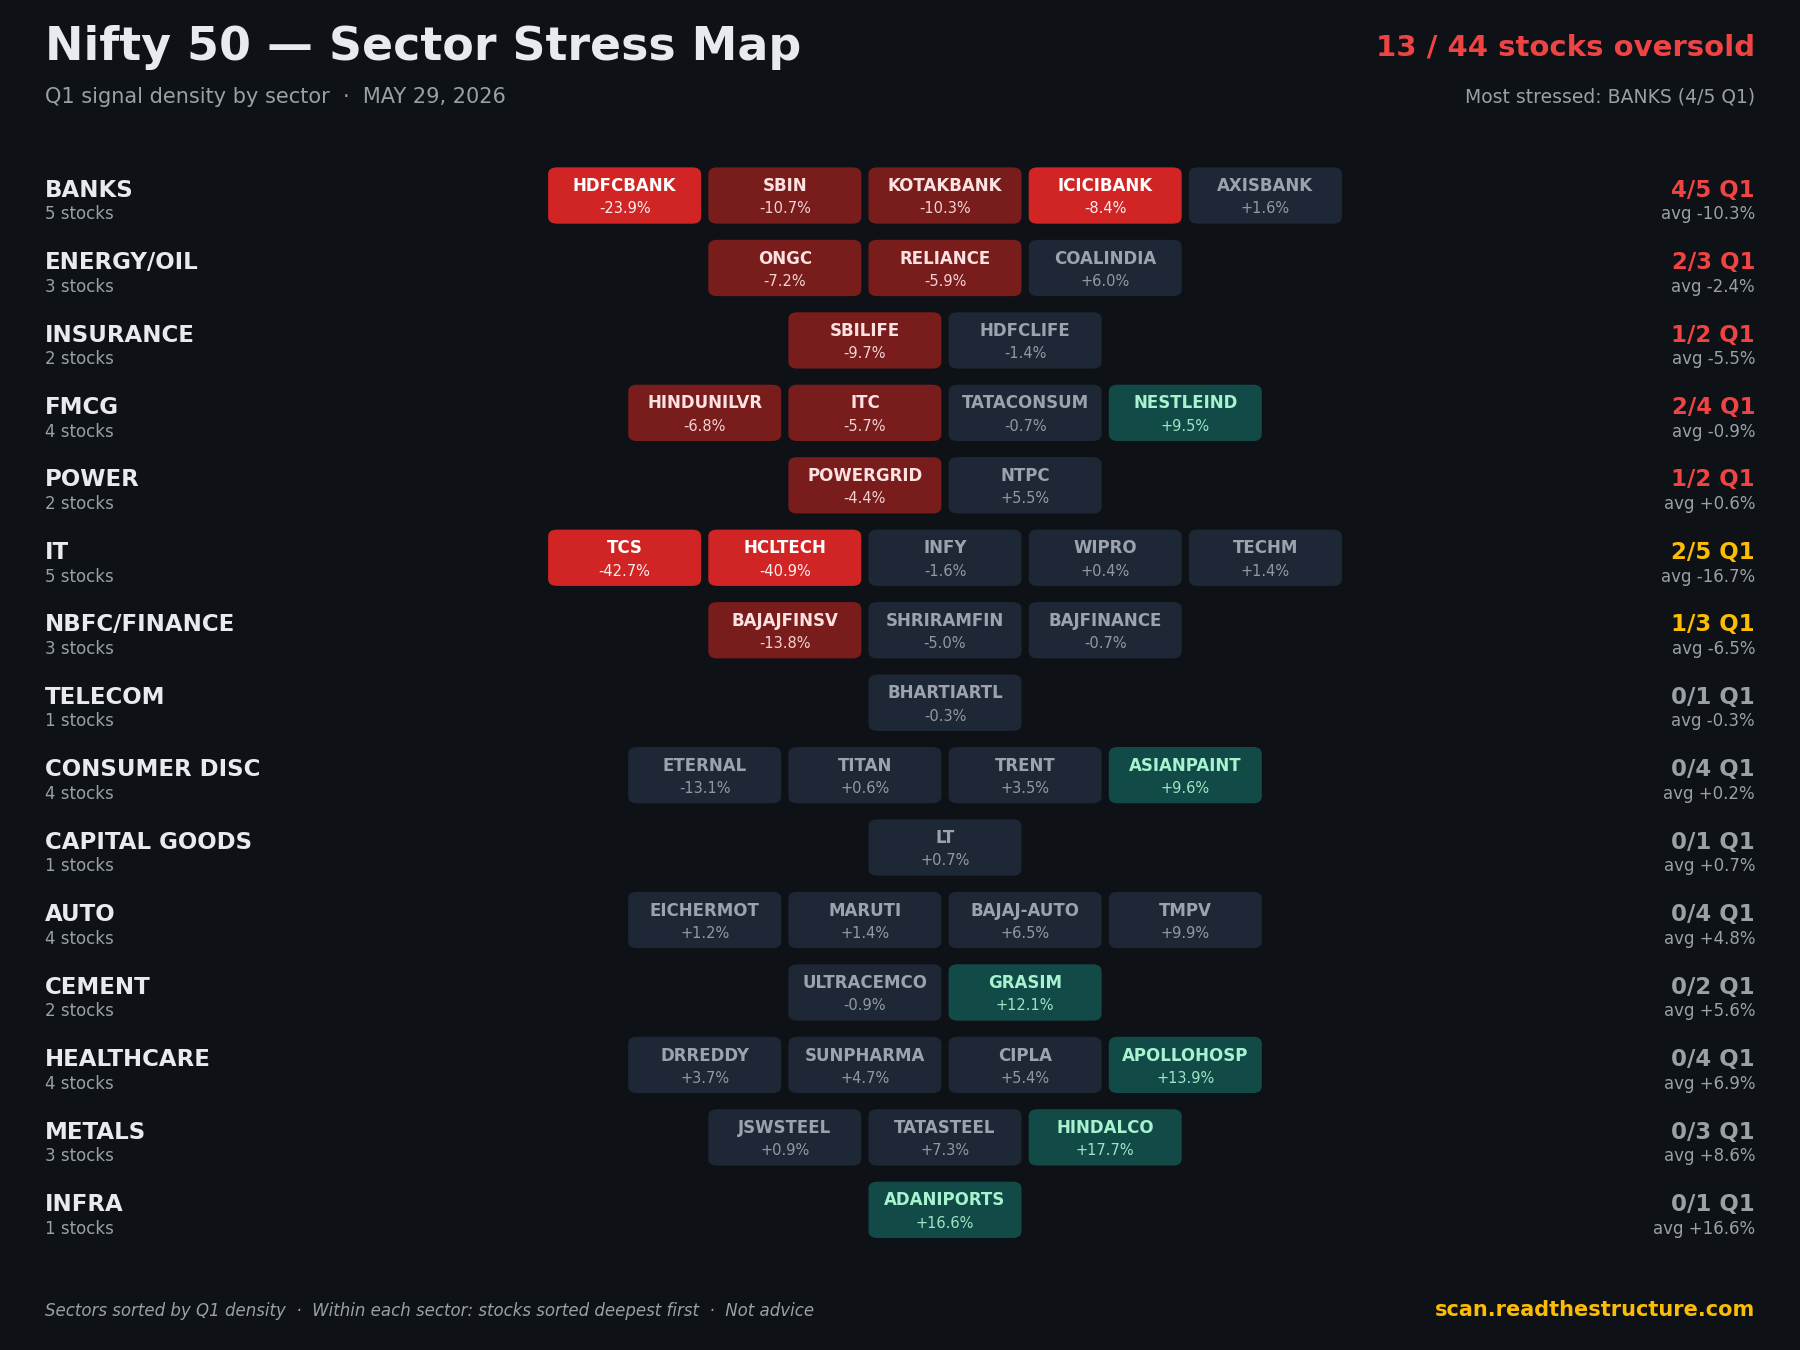
How to read this
A daily volume-and-time Market Profile scan of the Nifty 50. We measure how far each stock trades from its 6-month Point of Control (POC) — the price where the most activity has occurred — and flag mean-reversion setups.
POC — Point of Control
The single price with the highest traded volume/time over the last 6 months. It acts as a fair-value magnet: price tends to revert toward it.
Value Area (VAL–VAH)
The band containing ~70% of activity, from Value-Area-Low to Value-Area-High. Trading below VAL means a stock is stretched below where the market agreed on value.
Q1 / Q1·DEEP signals
Quantile of a stock's distance-from-POC vs its own history. Q1 = unusually oversold; Q1·DEEP = in the deepest tail. These are the mean-reversion watch tiers.
Q1·DEEP edge
From a 49-stock × 5-year backtest.
Q1 edge
Shallower tier — lower, but still positive, expectancy.
What this is not
This is scanner output, not a recommendation. It describes structure derived from public prices. It does not account for news, fundamentals, or your risk. Always do your own work.
See the structure, not just the price.
This free daily snapshot is a glimpse of what ReadTheStructure is building — a full Market Profile toolkit for NSE & MCX traders: live TPO & Volume Profile, Initial Balance, value-area tracking, OrderFlow and market-pulse alerts. Launching soon.